- News
- Forum
- Fachbeiträge
- Grundlagen (95)
- Branchen (49)
- Funktional (89)
- Kostenmanagement (27)
- Konzepte (82)
- Kennzahlen (370)
- Finanzplanung (61)
- Budgetierung (9)
- Reporting / Berichtswesen (35)
- BSC (7)
- Projektcontrolling (17)
- Kostenrechnung (412)
- IAS / IFRS (4)
- Risikomanagement (36)
- Investitionsrechnung (73)
- Unternehmensbewertg. (12)
- Rating (6)
- Business Intelligence (81)
- Excel-Tipps (201)
- Studien (8)
- Arbeitsmarkt (20)
- Spar-Tipps (2)
- Controlling-Journal (23)
- Finanzmathem. Formeln (15)
- Neulich im Golfclub (53)
- Softskills (27)
- Sonstiges (17)
- Artikel-Serien
- Stichwortverzeichnis
- Marktplatz
- Karriere / Stellenmarkt
- Excel-Vorlagen
- Online-Kurse
- Glossar
Excel Tool: Template for a portfolio matrix (BCG matrix)
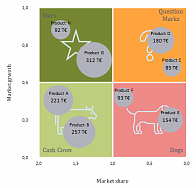
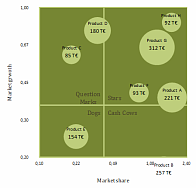
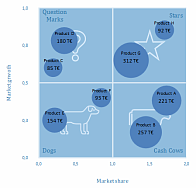
This Excel template enables you to create a portfolio matrix after the pattern of the Boston Consulting Group (also four fields matrix, growth-share matrix or BCG matrix). In a coordinate system of relative market share and market growth the products to be analyzed are displayed as circles, where the circular areas are proportional to sales.
Features:
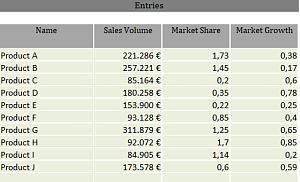
- Capture name, revenue, market share and market growth for up to 20 products
Seven prepared designs are available, which can be configured directly with just a few clicks and entries in the Excel spreadsheet:
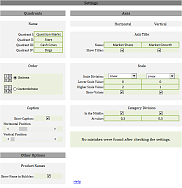
- Alternatively label of the quadrants (default: Question Marks, Stars, Cash Cows, Dogs)
- Arrangement of the quadrants (orientation of the horizontal axis)
- Positioning of quadrant label with the help of sliders
- Optional display of the illustrations of the quadrants (Question Mark, Star, Cow, Dog)
- Switching the labels of the bubbles on and off
- Determine whether bubble areas correspond to sales or whether all bubbles should be the same size
- Editing the title of the axis (default: relative market share, market growth)
- Either linear or logarithmic axis division
- Scaling of the axes (default: relative market share - from 0 to 1, market growth - from 0 to 2)
- Setting the division lines of the quadrants (in the middle or at defined value)
The setting options are self-explanatory and their impact is immediately visible in a preview image.
The template is created for Excel version 2010. Its possible that the template does not work under Macintosh. It contains no macro (VBA) code.
Weitere Produktbilder:
|
Anzeige
Premium-Mitglied werden und sparen!
Als Premium-Mitglied erhalten Sie Zugang zu vielen Excel-Vorlagen, Fachbeiträgen und Video-Kursen, die sonst kostenpflichtig sind. Darüber hinaus erhalten Sie 10% Rabatt beim Kauf von anderen Excel-Vorlagen hier im Shop.
Weitere Informationen zur Premium-Mitgliedschaft und ihren Vorteilen erhalten Sie hier >>
Bitte beachten Sie: Alle Vorlagen wurden durch unsere Fachredaktion sorgfältig überprüft. Wir können jedoch keinerlei Haftung oder Garantie für die individuelle Nutzung dieser Vorlagen übernehmen (siehe AGB).
Controlling- Newsletter
Neben aktuellen Neuigkeiten für Controller und neu eingegangene Fachartikel, informieren wir Sie über interessante Literaturtipps, Tagungen , Seminarangebote und stellen Ihnen einzelne Software- Produkte im Detail vor.Werden Sie jetzt monatlich über neue Fachbeiträge, Controlling-Tools und News informiert! Zur Newsletter-Anmeldung >>
Über 3.000 Artikel und Vorlagen

Werden Sie Mitglied in einer großen Controller-Community (fast 12.000 Mitglieder!) und erhalten Zugriff auf viele Inhalte und diskutieren ihre Fragen im Controlling-Forum.
Sehen Sie hier die neuesten Fachbeiträge >>
Eine neue Stelle?
Mit dem Studium fertig, Umzug in eine andere Region, Aufstiegschancen nutzen oder einfach nur ein Tapetenwechsel? Dann finden Sie hier viele aktuell offene Stellen im Controlling.Zu den Stellenanzeigen >>

Sie suchen einen Controller? Mit einer Stellenanzeige auf Controlling-Portal.de erreichen Sie viele Fachkräfte. weitere Informationen >>
KLR-Begriffe von A bis Z
Testen Sie ihr Wissen mit unseren Aufgaben und Lösungen im Bereich Kostenrechnung >>Sie haben eine Frage?

Nutzen Sie kostenfrei das Forum für Controller und und diskutieren ihre Fragen zu Controlling-Themen.
Riesen- Ressource
Auf Controlling-Portal.de sind bereits über 1.500 Fachbeiträge veröffentlicht und ständig kommen neue dazu.Zu den neuesten Fachbeiträgen >>
Zu den derzeit meistgelesenen Fachbeiträgen >>
Zu den Premium-Beiträgen >>
Sie möchten auch einen Fachbeitrag hier veröffentlichen? Dann erhalten Sie hier weitere Informationen >>
Amüsante Glosse

Erfolgreiche Unternehmer einer Kleinstadt treffen sich regelmäßig im örtlichen Golfclub und diskutieren mit Ihrer Lieblingskellnerin und BWL-Studentin Pauline betriebswirtschaftliche Probleme. Amüsant und mit aktuellem Bezug geschrieben von Prof. Peter Hoberg.
Zur Serie "Neulich im Golfclub" >>
News
Sie möchten sich weiterbilden?

In unserer Seminar-Rubrik haben wir einige aktuelle Seminar- und Kurs-Angebote für Controller, u.a. auch Kurse zum Controller / IHK zusammengestellt.
Premium-Mitgliedschaft
Erhalten Sie Zugriff auf Premium-Inhalte von Controlling-Portal.de und Rechnungswesen-Portal.de. Aktuelle und ständig erweiterte Fachbeiträge. Verschaffen Sie sich hier einen Überblick über unsere Premium-Inhalte.Mitgliedschaft wahlweise für nur 119,- EUR für ein Jahr, 199,- für 2 Jahre oder 399,- für 5 Jahre Laufzeit! Studenten und Auszubildende 39,- EUR für zwei Jahre! Kein Abonnement! Weitere Informationen >>
Wie zufrieden sind Sie mit uns?
Über Ihre Meinung und auch ihre Anregungen für Veränderungen oder Erweiterungen würden wir uns sehr freuen. Nur 10 kurze Fragen, die schnell beantwortet sind. Vielen Dank im Voraus für Ihre Mithilfe! zur Umfrage >>Jobletter und Newsletter!
Mit dem monatlich erscheinenden Newsletter werden Sie über neue Fachbeiträge, News und Excel-Tools informiert! zur Anmeldung >>Der 14-tägige Jobletter informiert Sie automatisch über neue Stellenangebote und Arbeitsmarkt-News! zur Anmeldung >>
Fachbeitrag veröffentlichen?
Sie sind Autor von Fachbeiträgen mit Controlling-bzw. Rechnungswesen-Thema? Gerne veröffentlichen oder vermarkten wir ihren Fachbeitrag. Eine kurze Autorenvorstellung oder Unternehmensdarstellung am Ende des Artikels ist möglich. jetzt Mitmachen >>Talentpool - Jobwechsel einfach!

Tragen Sie sich kostenfrei im Talentpool auf Controlling-Portal.de ein und erhalten Jobangebote und Unterstützung beim Jobwechsel durch qualifizierte Personalagenturen.
Buch-Vorstellungen
Kennzahlen-Guide
 Über 200 Kennzahlen aus Finanzen, Personal, Logistik, Produktion, Einkauf, Vertrieb, eCommerce und IT.
Jede Kennzahl wird in diesem Buch ausführlich erläutert. Neben der Formel wird eine Beispielrechnung aufgeführt. Für viele branchenneutrale Kennzahlen stehen Zielwerte bzw. Orientierungshilfen für eine Bewertung zur Verfügung. Für die genannten Bereiche hat die Redaktion von Controlling-Portal.de jeweils spezialisierte Experten als Autoren gewonnen, die auf dem jeweiligen Gebiet über umfangreiche Praxiserfahrung verfügen.
Preis: ab 12,90 Euro Brutto mehr Informationen >>
Dashboards mit Excel
 Wie erstelle ich ein Tacho- oder Ampel-Diagramm? Wie kann ich Abweichungen in Tabellen ansprechend visualisieren? Das wird Ihnen hier anschaulich erklärt.
 Taschenbuch in Farbe für 34,90 EUR
oder E-Book für 12,90 EUR
mehr Informationen >>
Reporting 1x1
 Viel ist zum Berichtswesen oder Reporting schon geschrieben worden. Dennoch zeigen Umfragen, dass rund 50 Prozent der Empfänger von Berichten mit dem Reporting nicht zufrieden sind. Jörgen Erichsen erklärt in diesem Buch die Bedeutung und die Handhabung des Berichtswesens speziell für kleinere Betriebe. Mit zahlreichen Beschreibungen, Beispielen und Checklisten.
Taschenbuch in Farbe für 24,90 EUR
oder E-Book für 15,90 EUR
mehr Informationen >>
Anzeige
Wie zufrieden sind Sie mit uns?

Über Ihre Meinung und auch ihre Anregungen für Veränderungen oder Erweiterungen würden wir uns sehr freuen. Nur 3 kurze Fragen, die schnell beantwortet sind. Vielen Dank im Voraus für Ihre Mithilfe! zur Umfrage >>
Anzeige
Stellenanzeigen
Controller*in (m/w/d) Kaufmännisches Controlling Das sind wir: Modernes Akutkrankenhaus in kommunaler Trägerschaft, Maximalversorger, 833 Betten, 16 Kliniken, zwei Institute und ein medizinisches Versorgungszentrum. Unsere größte Stärke: Rund 2.500 engagierte Kolleginnen und Kollegen. Wir sind einer der größten Ausbildungsbetriebe der Stad... Mehr Infos >>
Gruppenleitung (m/w/d) Unternehmenscontrolling
 Das Helmholtz-Zentrum Hereon betreibt internationale Spitzenforschung für eine Welt im Wandel: Rund 1.000 Beschäftigte leisten ihren Beitrag zur Bewältigung des Klimawandels, der nachhaltigen Nutzung der weltweiten Küstensysteme und der ressourcenverträglichen Steigerung der Lebensqualität. ... Mehr Infos >>
Division Controller (m/f/d)
 Exciting opportunities await you – as Division Controller (m/f/d), you will act as business partner for local SAP FICO teams in ELANTAS and corporate ALTANA Controlling, Accounting and Tax entities, you will review and analyze monthly closing results in AIDA reporting for actuals, forecas... Mehr Infos >>
Controller*in – Forschungsinstitut
 Die Fraunhofer-Gesellschaft (www.fraunhofer.de) betreibt in Deutschland derzeit 76 Institute und Forschungseinrichtungen und ist eine der führenden Organisationen für anwendungsorientierte Forschung. Rund 32 000 Mitarbeitende erarbeiten das jährliche Forschungsvolumen von 3,4 Milliarden ... Mehr Infos >>
Finanzbuchhalter / Bilanzbuchhalter Buchhaltung & Controlling (m/w/d)
 Sie lieben Zahlen? Sie behalten auch bei komplexen Finanzthemen den Überblick und fühlen sich in der Welt von Bilanzen, Buchungen und Jahresabschlüssen zu Hause? Von der sorgfältigen Verbuchung einzelner Geschäftsvorfälle bis hin zur Mitwirkung an strategischen Finanzentscheidungen – Sie beeindru... Mehr Infos >>
Stellvertretende Abteilungsleitung Rechnungswesen (m/w/d)
 Das Versorgungswerk der Landesärztekammer Hessen ist eine teilrechtsfähige Einrichtung der öffentlich-rechtlichen Körperschaft der Landesärztekammer Hessen. Wir sind die Rentenversicherung für hessische Ärztinnen und Ärzte und sichern in einem kapitalgedeckten Finanzierungssystem die Alters-, Ber... Mehr Infos >>
Controller (m/w/d) Schwerpunkt Werkscontrolling und Produktkalkulation
 Die TPG – The Packaging Group ist ein Firmenverbund international führender Hersteller und Entwickler von hochwertigen Verpackungsmaschinen. Durch den Zusammenschluss der Unternehmen FAWEMA, HDG und WOLF vereint die TPG Traditionsmarken, die über einzigartiges Know-how und eine herausragende Tech... Mehr Infos >>
Gruppenleitung (m/w/d) Finanzen
 Das Helmholtz-Zentrum Hereon betreibt internationale Spitzenforschung für eine Welt im Wandel: Rund 1.000 Beschäftigte leisten ihren Beitrag zur Bewältigung des Klimawandels, der nachhaltigen Nutzung der weltweiten Küstensysteme und der ressourcenverträglichen Steigerung der Lebensqualität. ... Mehr Infos >>
Weitere Stellenanzeigen im Stellenmarkt >>
Veranstaltungs-Tipp

Sie sind Controller und wollen Ihre Excel oder Power-BI Kenntnisse verbessern? Dann sind unsere Excel /Power-BI Schulungen genau das Richtige für Sie! Lernen Sie, wie Sie Daten effizient analysieren, visualisieren und präsentieren können. Nutzen Sie die Vorteile von Pivot-Tabellen, Formeln, Makros und mehr. Melden Sie sich jetzt an und werden Sie zum Excel oder Power-BI Profi!
Mehr Infos >>

eBook: Controlling mit Chat GPT
Dieses Buch zeigt praxisnah, wie Sie ChatGPT effektiv in Ihren Controlling-Alltag integrieren können. Von der Erstellung intelligenter Prompts bis hin zur Automatisierung von Controlling-Prozessen – Sie erhalten das Wissen und die Werkzeuge, um Ihre Arbeit auf das nächste Level zu heben.Jetzt hier für 9,99 EUR downloaden >>
Excel-Tool Bilanz- und Erfolgsanalyse
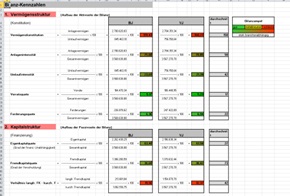
Aus Bilanz und G+V werden alle gängigen Bilanz- und Erfolgskennzahlen errechnet und versucht, die Bewertung der Zahlen mit den Ampelfarben grün, gelb und rot deutlich zu machen. Die Ableitung bzw. Berechnung der Kennzahlen wird ausführlich dargestellt.
Jetzt hier für 34,- EUR downloaden >>
Excel-Tools für Controller!

Über 500 Vorlagen direkt zum Download. Verschaffen Sie sich einen Überblick >>
Software-Tipps

Jabatix NC ist eine Rechenmaschine, als add-on für Excel, für Controller in kleinen und mittleren Unternehmen. Sie führt komplexe Berechnungen durch und stellt die Ergebnisse in EXCEL bereit – ohne lange Einarbeitung. Mehr Informationen >>
Diamant/3 bietet Ihnen ein Rechnungswesen mit integriertem Controlling für Bilanz- / Finanz- und Kosten- / Erfolgs- Controlling sowie Forderungsmanagement und Personalcontrolling. Erweiterbar bis hin zum unternehmensweiten Controlling. Mehr Informationen >>
Weitere Controlling-Software-Lösungen im Marktplatz >>
Reisekostenabrechnung 2025
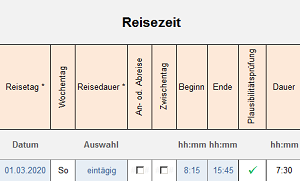
Diese Excel-Vorlage eignet sich zur Reisekostenabrechnung in allen Branchen für Unternehmen, deren Angestellte, Vereine und Organisationen, Gewerbetreibende sowie Freiberufler. Das Tool unterstützt die aktuellen in Deutschland geltenden gesetzlichen und steuerlichen Richtlinien für die Abrechnung von Reisekosten.
Mehr Informationen >>
RS-Businessplan
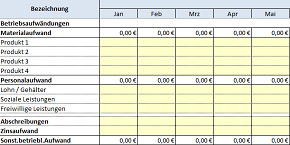
Unternehmen mit Balanced Scorecard (BSC) im Einsatz sind erfolgreicher als ihre Wettbewerber. Erstellen Sie mit RS-BSC Ihre Balanced Scorecard! Definieren und überwachen Sie mit Hilfe dieser Excel-Vorlage ihre operativen und strategischen Ziele.
Mehr Informationen >>
Liquiditätsplanung XL
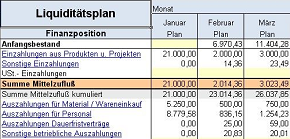
Mit der RS-Liquiditätsplanung können Sie die Liquidität planen. Die Planung erfolgt dabei über einzelne Sichten, welche komprimiert im Liquiditätsplan ausgegeben werden. Das Tool beinhaltet unter anderem zwei Jahresplanung und eine Detailsicht für Ein- und Auszahlpositionen. Mehr Informationen >>
Weitere über 400 Excel-Vorlagen finden Sie hier >>
Skript Kostenrechnung
Umfassendes Skript für Studenten, Auszubildende und angehende Bilanzbuchhalter zu allen prüfungsrelevanten Themen aus der Kosten- und Leistungsrechnung als ebook im pdf-Format. Auf 163 Seiten wird alles zum Thema Kostenrechnung ausführlich und verständlich sowie mit vielen Abbildungen und Beispielen erläutert.Themen:
- Kostentheorie
- Aufgaben und Systeme der Kostenrechnung
- Vollkostenrechnung
- Teilkostenrechnung (Deckungsbeitragsrechnung)
- Plankostenrechnung
- Kurzfristige Erfolgsrechnung
- Prozesskostenrechnung
- Kalkulation im Handel
Zusätzlich zum Skript erhalten Sie umfangreiche Klausuraufgaben und Übungsaufgaben mit Lösungen! Preis 9,90 EUR Hier bestellen >>
Excel TOP-SellerRS Liquiditätsplanung L

Die RS Liquiditätsplanung L ist ein in Excel erstelltes Werkzeug für die Liquiditätsplanung von Kleinunternehmen sowie Freiberuflern. Die Planung erfolgt auf Basis von veränderbaren Einnahmen- und Ausgabepositionen. Detailplanungen können auf extra Tabellenblättern für z.B. einzelne Projekte oder Produkte vorgenommen werden.
Mehr Informationen >>
Rollierende Liquiditätsplanung auf Wochenbasis
Dieses Excel-Tool bietet Ihnen die Grundlage für ein Frühwarnsystem. Der erstellte Liquiditätsplan warnt Sie vor bevorstehenden Zahlungsengpässen, so dass Sie frühzeitig individuelle Maßnahmen zur Liquiditätssicherung einleiten können. Gerade in Krisensituationen ist eine kurzfristige Aktualisierung und damit schnelle Handlungsfähigkeit überlebenswichtig. Mehr Informationen >>Strategie-Toolbox mit verschiedenen Excel-Vorlagen
Die Strategie-Toolbox enthält 10 nützliche Excel Vorlagen, die sich erfolgreich in der Strategie bewährt haben. Alle Tools sind sofort einsatzbereit und sind ohne Blattschutz. Damit können die Vorlagen individuell angepasst werden. Ideal für Mitarbeiter aus dem strategischen Management. Mehr Informationen>>
Weitere über 400 Excel-Vorlagen finden Sie hier >>
Software-Tipp
 Rollierende Liquiditätsplanung auf Wochenbasis. Mit der Excel-Vorlage „Liquiditätstool“ erstellen Sie schnell und einfach ein Bild ihrer operativen Liquiditätslage für die nächsten (bis zu 52) Wochen. Mehr Infos und Download >>
